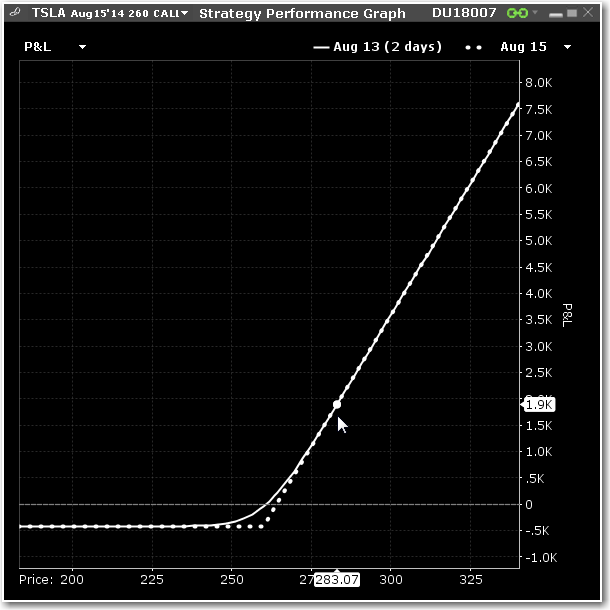
Strategy Performance Graph
Displays the P&L (or any of the Greeks) as a function of the underlying price. The graph is displayed as part of the Performance Profile, and can also be opened as its own window.
To open the Strategy Performance Graph
- From Mosaic - From the New Window drop down list select Option Analysis and then Strategy Performance Graph.
- From Classic TWS - From the Analytical Tools menu, select Option Analysis and then Strategy Performance Graph.