Intraday Volume Weighted Average Price
Tracks VWAP throughout the day, and displays as a colored line linking VWAP values at varying times throughout the one-day period. By default, the line that tracks Intraday VWAP is bracketed within a high/low standard deviation range. The standard deviation is calculated for the same period as the VWAP, and the range can be adjusted by modifying the number of Standard Deviations within the settings of the Intraday VWAP.
Intraday VWAP is calculated as: VWAP=[sum (Volume_bar_i * Typical_price_i)]/sum(volume_bar_i) where i is the intraday bar number. If we use a 1 min daily bar chart, the calculation is made from the first minute with i=[1;N] where N is the last bar number of the chart, Typical_price_i = VWAP_on_bar_price_i => This is the VWAP we currently store and volume_bar_i is the volume for the bar i. If no volume is available for the product (i.e. for IND, CASH and CMDY), use 1 as volume for each bar.
To apply an Intraday VWAP Indicator
- From within a chart, from the Edit menu select Studies.
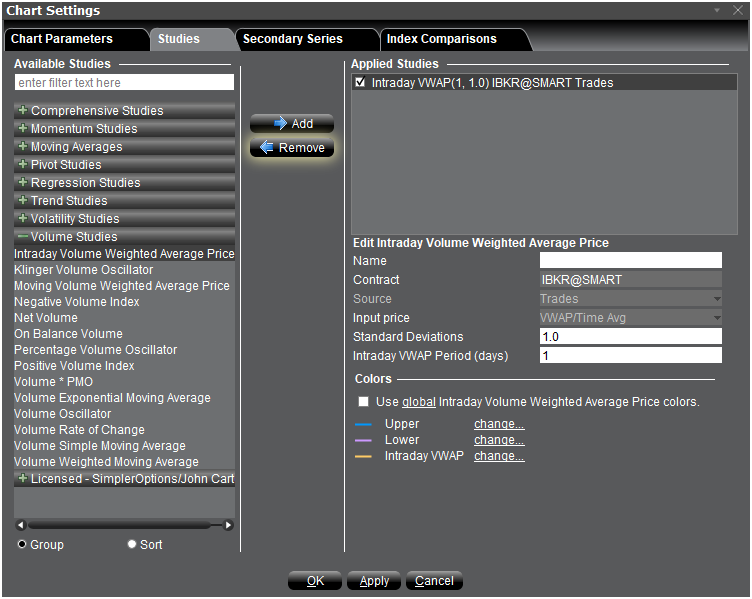
- Choose Intraday Volume Weighted Average Price and click Add to add the study to the Applied Studies group.
- Complete parameters as necessary.
Once the study is defined, you can elect to uncheck/check to remove and add the study to your chart.